
What’s Good for the Business? Revisiting My Raw Data Interview
In 2023, I was at Cerner, which Oracle had just acquired. I sat down with Rob Collie and Thomas LaRock to discuss my journey from BASIC programming in high school, studying English and writing in college, learning Microsoft Power BI and DAX, consulting, and working for Oracle…

Technical or functional: for me, it’s always functional
The pivotal moment in the job interview was when the interviewer asked me if I was more technical or functional and I answered functional. This is always the 'incorrect' answer in tech companies or to people with a heavy technical background, but I also doubled down on the functional side, which tells me where my interests and trajectory lie.…

AI Apocalypse: What, Me Worry?
I worked for a large software company and implemented one of the company's products for internal use. When I started with the company just a few years ago, executives would talk about building something of value for the long term and not looking only at the short term. Recently, however, there was a panicked flurry of town halls promoting education in and use of agentic AI, or LLM models trained to follow directions rather than conversing. And then came the Reduction in Force (RIFs): 30,000 people laid off by email. I was not surprised to be included. After all, I implemented software for a software company which has come to doubt the value of software.

Show up in a powerful fashion: even when remote
On the podcast, Pfeffer gave a couple of people as examples: one was a tall woman, who also wore heels. The other was a short man, who commanded a room as if he were much taller. While both of these examples are height related, they also emphasize leveraging your strengths is a persuasive way. They also connect with another rule, which is to create a powerful brand. It seems to me that in-person will always be more powerful than remote, but even so, there are things I do to show up in a powerful fashion in a remote workplace.
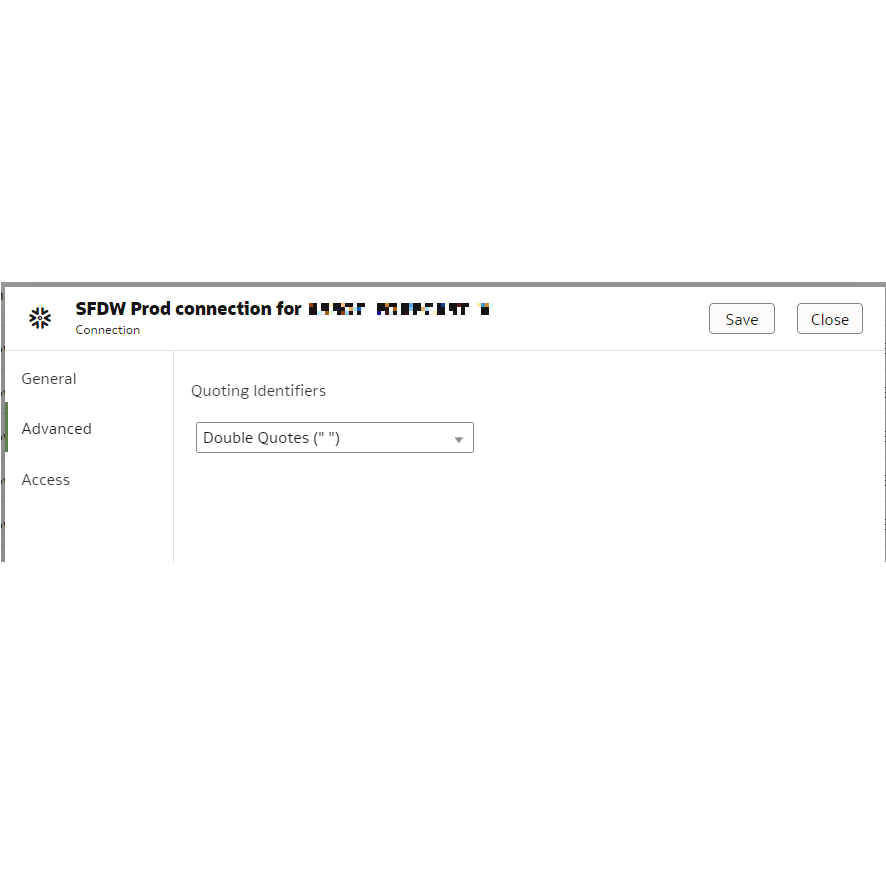
Oracle Analytics Cloud (OAC): invalid identifier error with mixed case column names in Snowflake
Problem: ‘invalid identifier’ error when connecting to columns which are named using mixed case in Snowflake database.
Solution: in the Advanced tab of the connection, turn on Quoting Identifiers: Double Quotes (“ “).

Making work visible with our family Kanban
Our family just started using Kanban in the house. Kanban is a project management tool useful for prioritizing tasks as they come up. It’s typically used in work situations like maintenance, where emerging issues might pop up. I’ve been wanting to try Kanban for our household, and finally got it done. …

The Power BI Synapse DP-500 Exam demonstrates why Microsoft needs Fabric
TL;DR: Power BI has evolved into a complicated feature-rich product. Fabric looks like an attempt to fold some of that complexity into the background, while including more comprehensive governance.
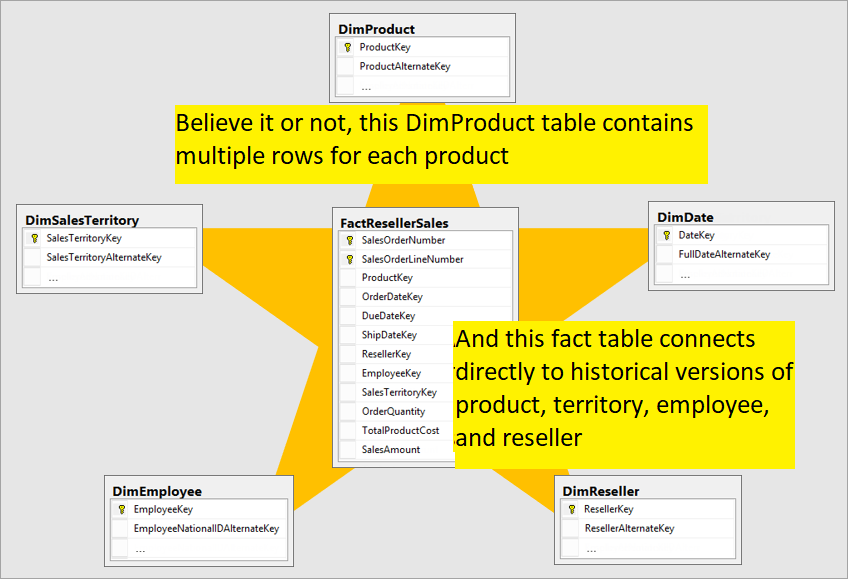
Cloud data warehouses: SCD Type 2 connected directly to the fact table
In the section of Azure Power BI D5-500 training, I was surprised (and delighted) to see that Slowly Changing Dimension (SCD) Type 2 is presumed as the format for dimensions— and that these historical dimensions were connected directly to the fact tables. Up to this point, most data warehouses I have run into have used SCD Type 1 as the default, and then required analysts to do gymnastics to connect to a historical dimension. [I also include a link for what to do if this is not the design of your data warehouse]
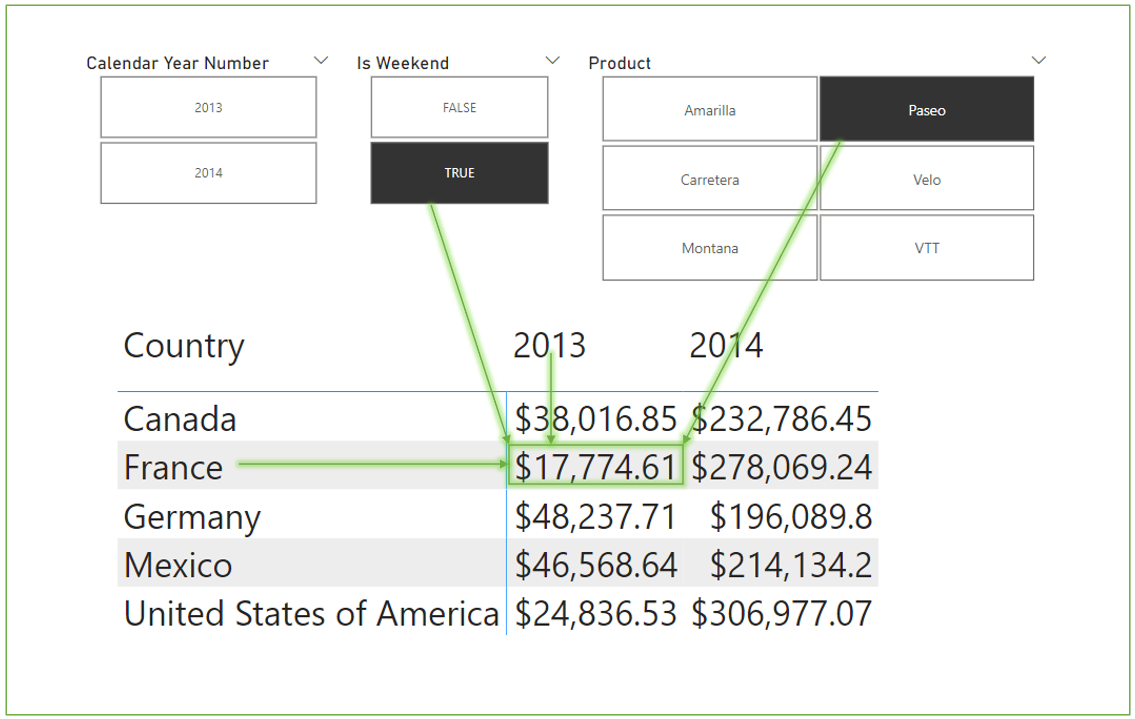
Better user interface through DAX: Always show only 4 quarters in Power BI
Simplicity is key to increasing usability. I want to enable report consumers to explore the data without having to think about the process of exploration. With this solution, a consumer can move back in time one quarter in time or jump from the current quarter to to the same quarter last year while keeping as much the same as possible, making it easier to think about comparisons.
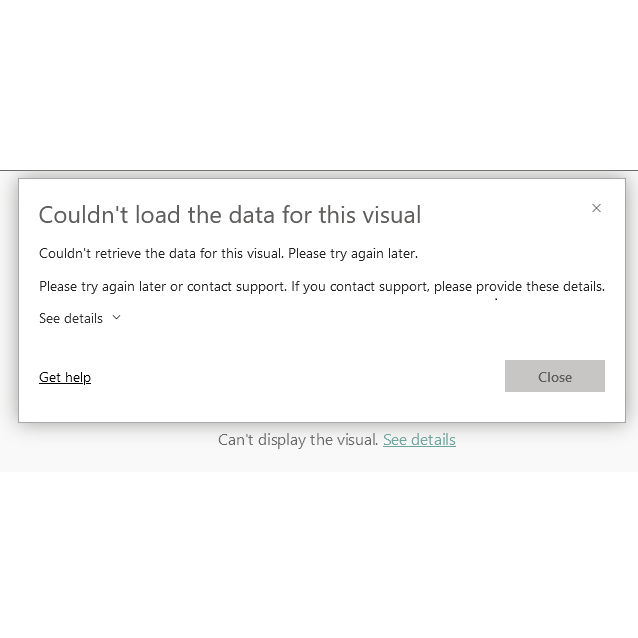
Power BI tile error: Couldn't retrieve the data for this visual. Please try again later.
This error, “couldn’t retrieve the data for this visual”, can be a frustrating one. Like other tile errors, it only shows as a broken tile with the message “can’t display the visual” until you click to see details. If we consult the official Power BI documentation on tile errors, the documentation currently says: “This issue is usually transient. If you try again later and still see this message, contact support.” I’ve seen the error in three situations: the most common is that a report consumer lacks build access to a report built on a DirectQuery over Power BI dataset connection.
DAX measure basics in Power BI or Excel data model
I decided to share my tips for learning DAX. 1. Learn about filter context; 2. use variables to debug measures, and 3. understand how CALCULATE works. At the end, I link two of my blog posts: one which applies the concepts of coordinates and values to the different visualizations available in Power; the other is how to troubleshoot the trickiest visual of them all: the table visual.

Analyzing dirty data (literature): narrators in Ernest J. Gaines’s story “Just Like a Tree”; also Power BI on-object formatting
On my About page, I claim that “I studied English Literature because it’s fun to find patterns in the unstructured data of a 1,000-page novel.” Nobody ever challenges me on this statement, so I thought I would give an example from my college years. I first read the short story, “Just Like a Tree,” when I was in community college.

Power Query: fix your data warehouse date table blues with these tips
Date table doldrums: I love getting date tables from data warehouses. I don’t love manually setting data types, renaming columns, and turning off default summarization for these columns. In this post, I use the ribbon and buttons for doing most of these things, and I use some custom M when needed to speed things up.

Filter by Excel or SharePoint list to make the server do the work in Power BI Desktop
Filter by List in Power BI Desktop instead of merge to keep query folding on. Step-by-step instructions. Contains link to sample file.

Build a robust data model from a data warehouse: presentation outline
build a robust data model in Power BI using a data warehouse presentation outline

Variables in M Power Query
Some details about how to use stand-alone and inline variables in M Power Query queries.

My Power BI guest blog posts
My guest post blogs on Power BI at P3 Adaptive. Data warehouse, data governance, and hacks!
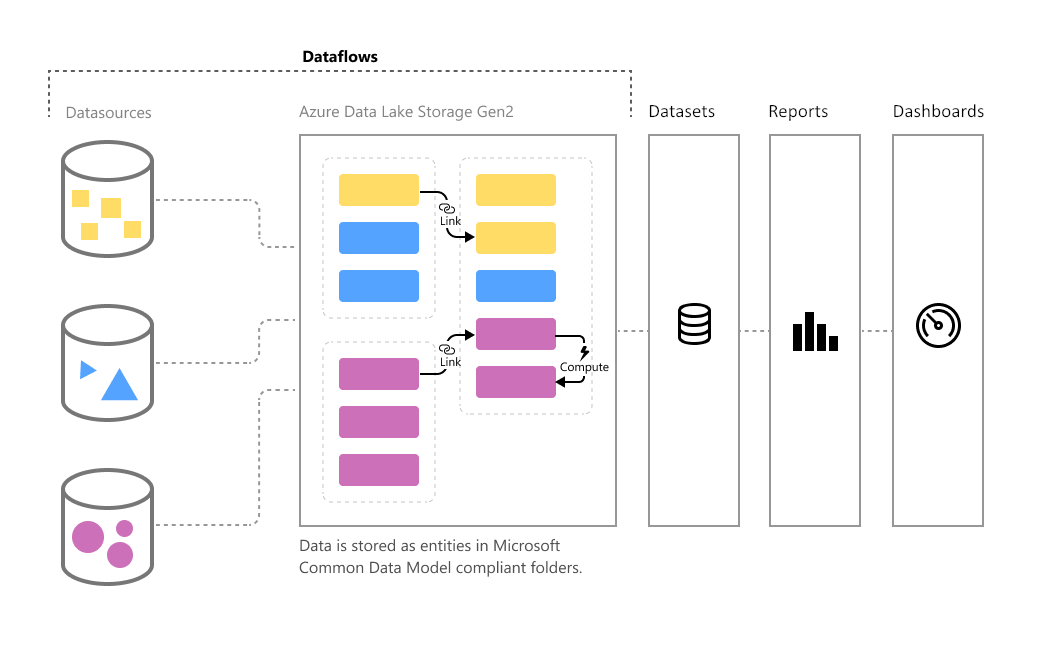
Rapidly Rebuild Enterprise BI with Power BI Dataflows
As a first step in moving from traditional BI to Power BI, build a data mart using Power BI dataflows.
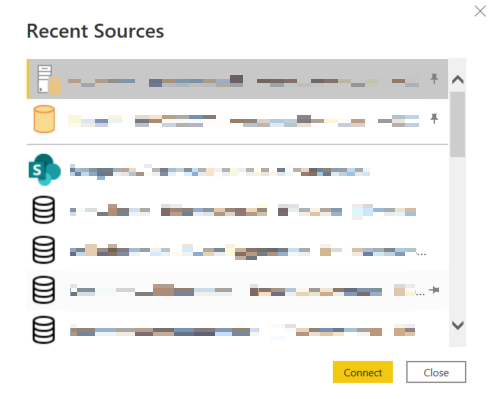
Pin Recent Data Sources in Power BI
Quick tip for pinning data sources in Power BI Desktop. Useful for SQL, Oracle, Snowflake, SharePoint, and other data sources instead of copy pasting every time.
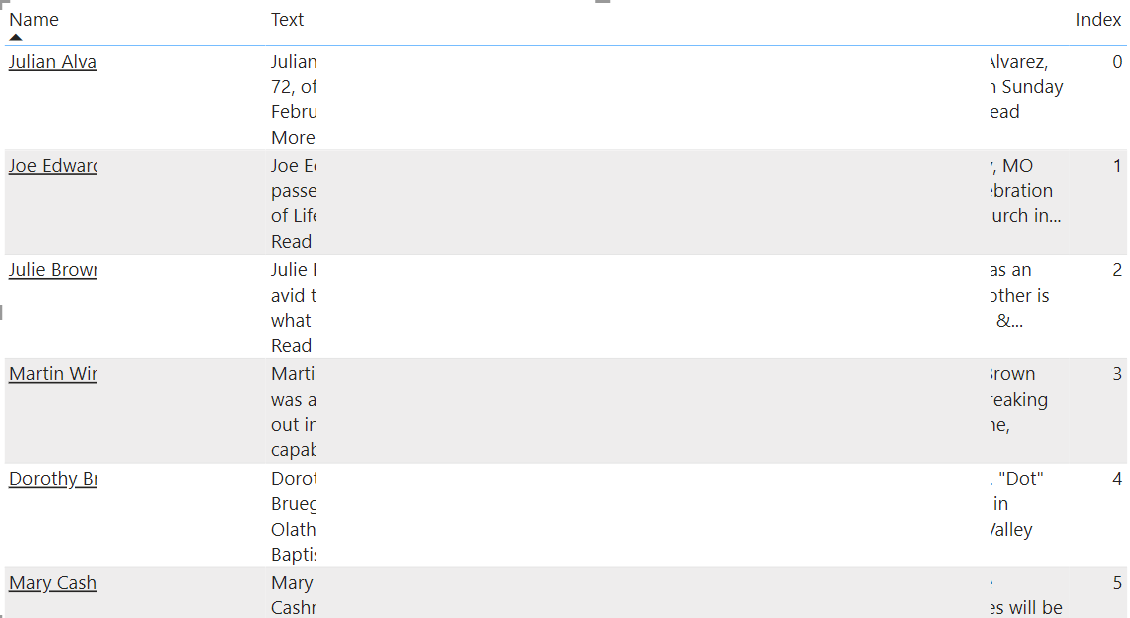
Web Scrape Multiple Columns - Power BI Obit Checker
Power BI. Get data from web, multiple columns. Obituaries.