
Anime and things hidden (spoilers)
Some incomplete thoughts on René Girard and anime treatment of sacrifice, rivalry, and mimetic desire.

Build a robust data model from a data warehouse: presentation outline
build a robust data model in Power BI using a data warehouse presentation outline

Some quotes about charisms
I’ve collected here several quotes about charisms in the Catholic Church…

Skateboarding in churches?
When I picked up To Give One’s Life for the Work of Another by Julian Carron, I noticed a kind of disconnect between myself and a topic in Carrón’s preface…

Variables in M Power Query
Some details about how to use stand-alone and inline variables in M Power Query queries.

Love in the Ruins is a weird damned book
It’s a weird book with some satirical teeth and some deep flaws


My Colbert Questionert
My responses to the Colbert Questionert. On this personal side of the blog, I’m going to do a classic personal stories blog again, some reviews and various topics of interest to me— conversational and not polemic. For now, let’s try an icebreaker.

My Power BI guest blog posts
My guest post blogs on Power BI at P3 Adaptive. Data warehouse, data governance, and hacks!

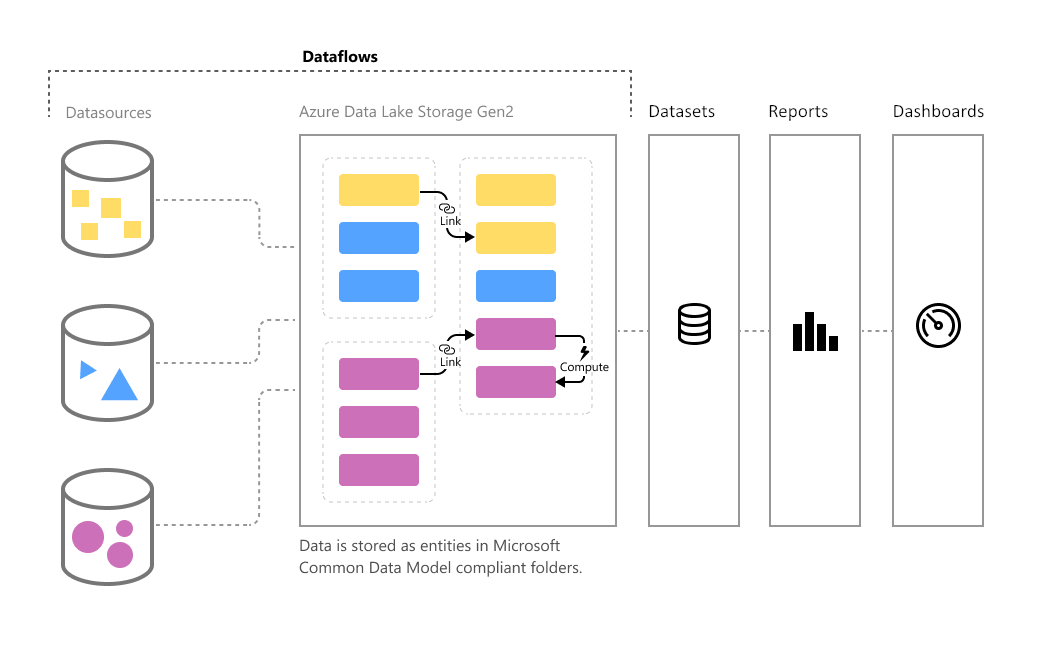
Rapidly Rebuild Enterprise BI with Power BI Dataflows
As a first step in moving from traditional BI to Power BI, build a data mart using Power BI dataflows.
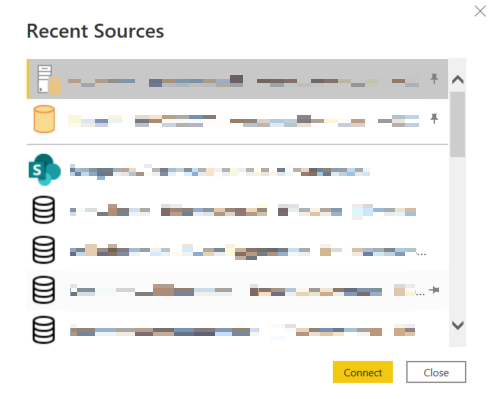
Pin Recent Data Sources in Power BI
Quick tip for pinning data sources in Power BI Desktop. Useful for SQL, Oracle, Snowflake, SharePoint, and other data sources instead of copy pasting every time.
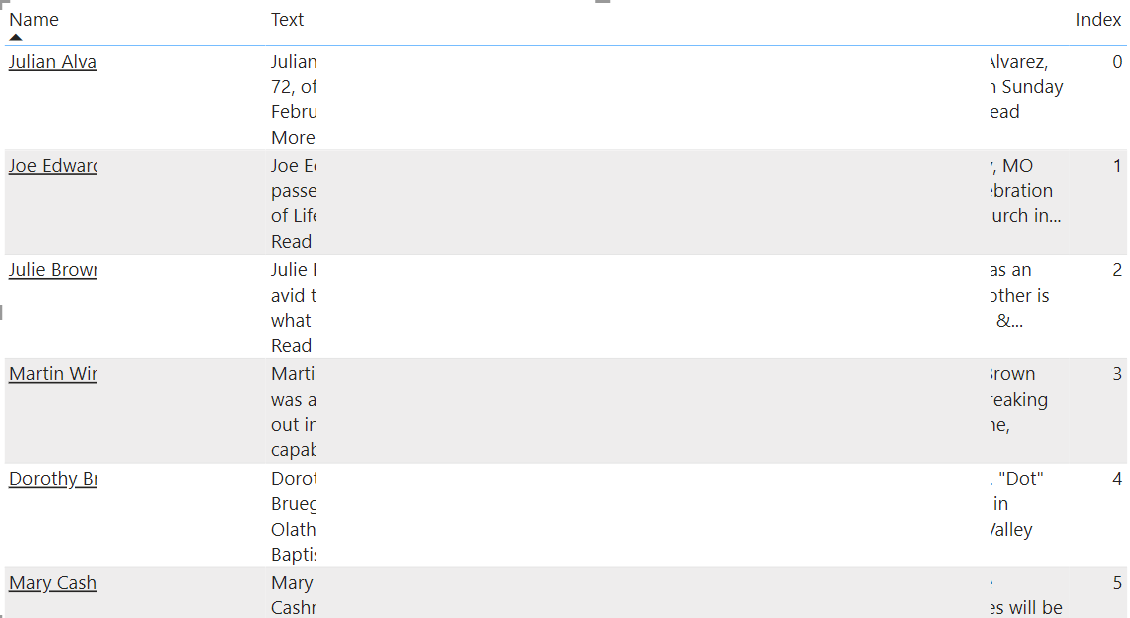
Web Scrape Multiple Columns - Power BI Obit Checker
Power BI. Get data from web, multiple columns. Obituaries.
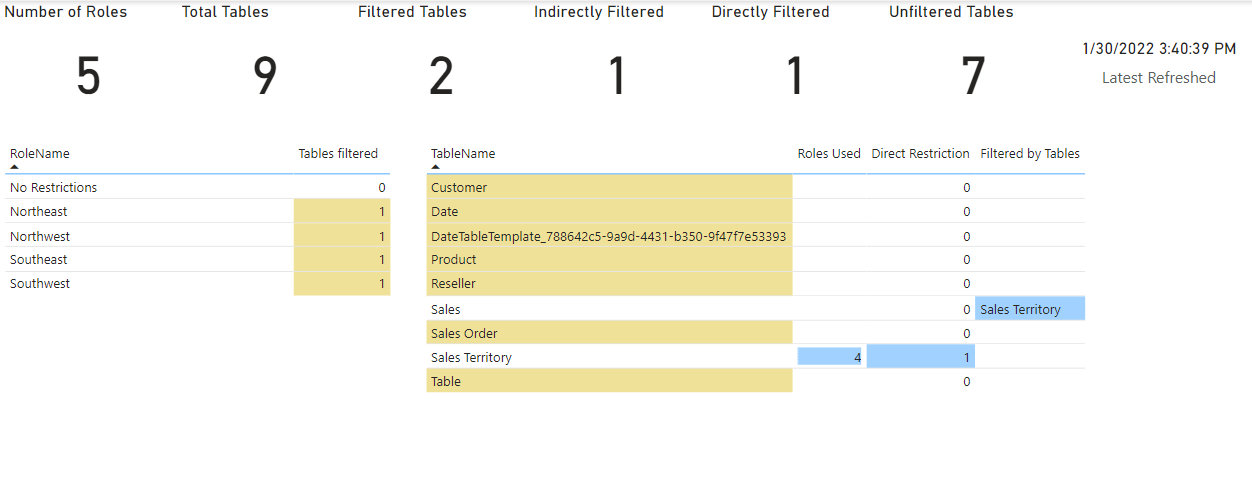
RLS Tool: Check row-level security in Power BI models
Tool to check row-level security in Power BI Desktop files or Power BI Premium

Merry Christmas 2021
In the past I’ve had specific goals and plans, but I feel that the next thing may be very different and better than I could imagine.

A Present for You: compare relationships in Power BI models
Tool to compare relationships between two models. 2 .pbix files, 2 models in premium workspaces. Or 1 local and one in premium.
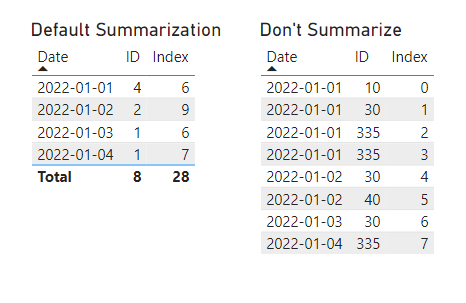
Troubleshooting Problems with Power BI Table Visuals
You can easily start using table visuals without having to know how they work under the hood. When you run into a problem, that’s when knowing about the mechanics becomes helpful.
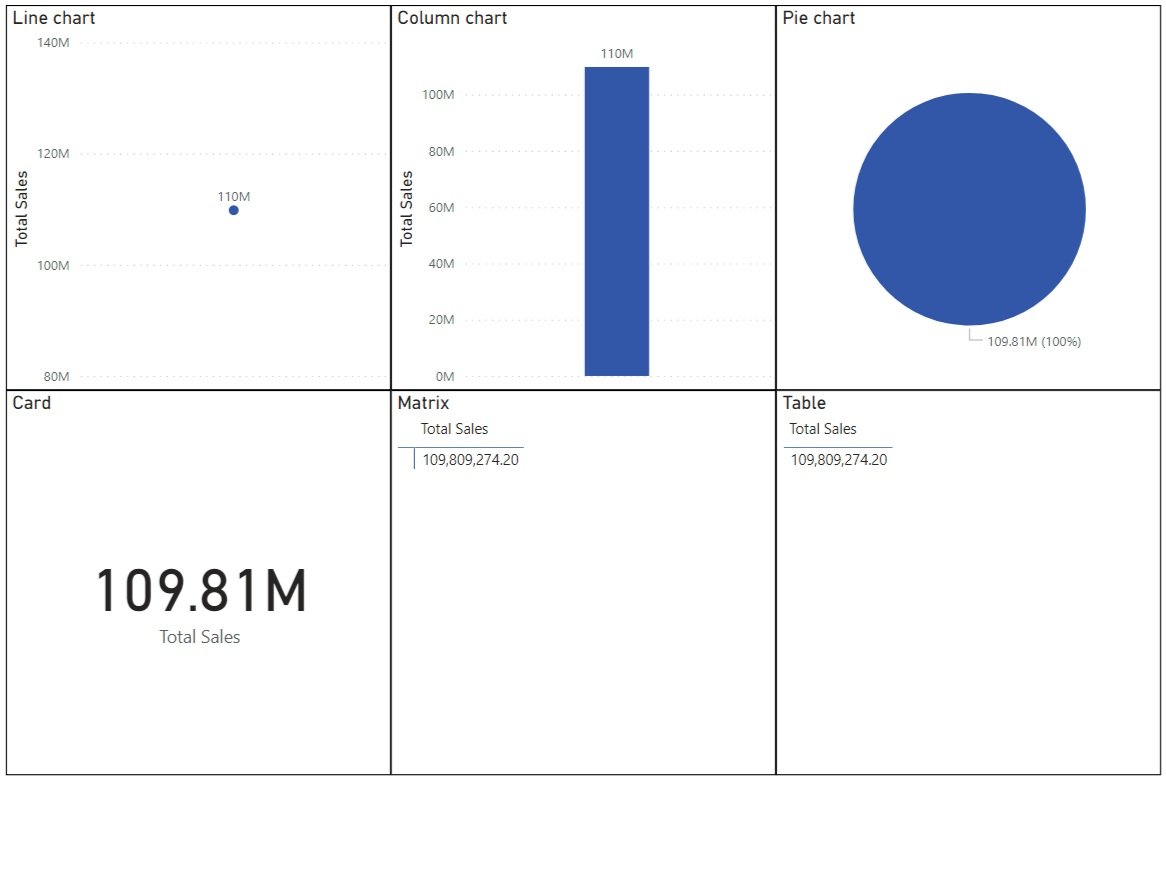
How Do Power BI Visuals Work? Values & Coordinates
Values & Coordinates. I think of values as dynamic and coordinates as static. If values are the amounts and the counts, then coordinates are the categories, attributes, and time units, which break up that value for comparison. In a Power BI data model, values typically come from transaction tables or fact tables, while coordinates typically come from lookup tables or dimensions.
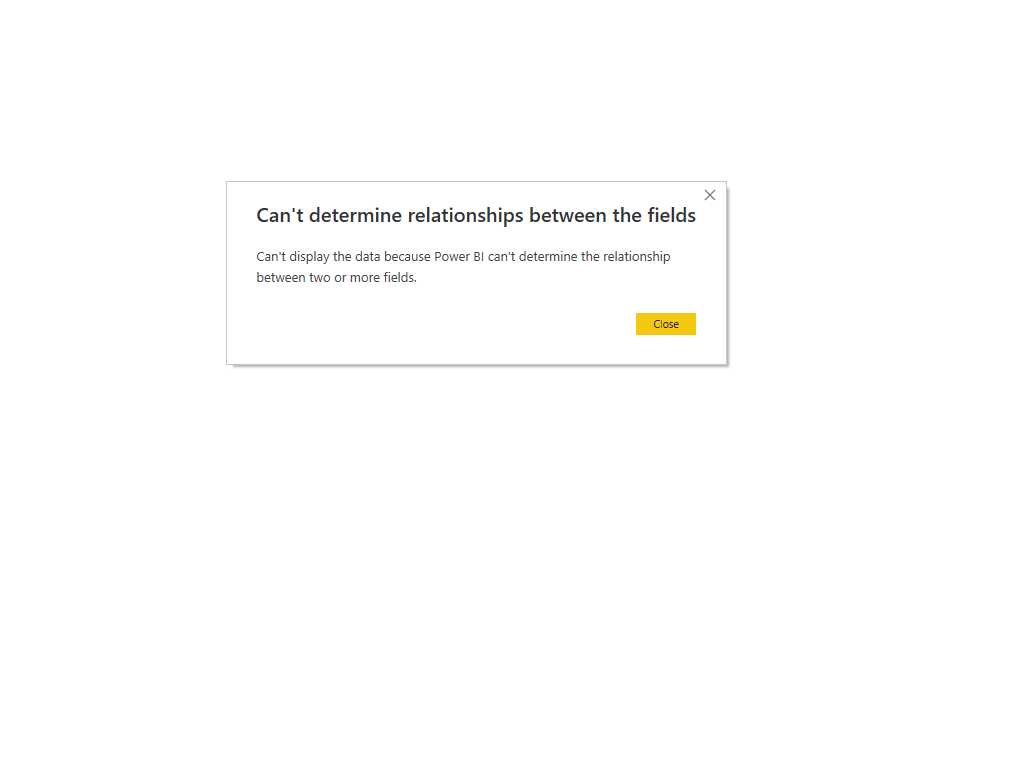
Can’t determine relationships between the fields: bidirectional
“Can’t determine relationships”: bi-directional filters. Most of the time this error means that a visual has two columns from different tables with no relationship between them. But, if can also happen when using bi-directional filters. The tables are related, but Power BI can’t figure out how to manage the cross-filtering.
